In this blog we’ll dive into the retirement of ContainerLog table in Azure Monitor container insights, and the transition to ContainerLogV2.
On 30 September 2026, Microsoft will retire the ContainerLog table in Azure Monitor container insights. To ensure your alerts and dashboards continue to work as expected, you are required to transition to the ContainerLogV2 table. We’ll walk you through the differences between them, and the transition process.
ContainerLog vs ContainerLogV2 schema
To meet the evolving needs of managing container logs, Microsoft Azure Monitor Container Insights offers a schema for container logs, called ContainerLog(V2). This serves as a vital component for tracking and analyzing container-related data within the Azure ecosystem. This schema contains fields to make common queries to view Azure Kubernetes Service (AKS) and Azure Arc-enabled Kubernetes data. With the new ContainerLogV2 schema, we’ll walk you through the differences below, so you can make informed decisions about log management for your resources.
Differences in onboarding
ContainerLogV1 is primarily configured through the ConfigMap, which is a resource object that allows you to decouple configuration artifacts from the containerized application and store them as key-value pairs. ConfigMaps are useful for managing configuration data in a more flexible and scalable manner within a Kubernetes cluster.
ContainerLogV2 offers an enhanced experience, as it can be configured both through the ConfigMap and DCR (Data Collection Rule). When both are enabled the ContainerLogV2 setting of the ConfigMap will take precedence. Additionally, ContainerLogV2 will be the default schema for customers who will onboard container insights with Managed Identity Auth using ARM, Bicep, Terraform, Policy and Portal onboarding.
It is important to note that DCR enablement is not supported for service principal-based clusters. In these cases it must be enabled through the ConfigMap.
Pricing differences
Pricing-wise there are some differences as well. ContainerLogV1 is only compatible with the full-priced analytics logs, which might be less cost-effective. ContainerLogV2 on the other hand, supports the low-cost basic logs tier, in addition to the analytics logs. This may be more attractive from a pricing perspective.
Querying and multiline features
Querying is made more efficient with ContainerLogV2, thanks to the inclusion of additional pod and container metadata. This reduces query complexity and the need for extensive joint operations. Querying ContainerLogV1 often involves multiple join operations with inventory tables for standard queries, making it relatively complex.
Another notable feature in ContainerLogV2 is the support for multiline logging, allowing for consolidated, single entries for multiline output. This again simplifies log analysis. ContainerLogV1 does not natively support multiline entries, resulting in log entries being split into multiple rows, and potentially complicating log analysis.
Migrate from ContainerLog to ContainerLogV2
As mentioned, ContainerLogV2 can be enabled at the cluster level through either the cluster’s Data Collection Rule (DCR) and ConfigMap. In the following instructions, we’ll cover both onboarding options. Remember that when both are enabled the ContainerLogV2 setting of the ConfigMap will take precedence.
Assessing the impact on your existing alerts
Migrating to ContainerLogV2 might require updates to your alert queries to ensure their functionality as expected to continue. Using Azure Resource Graph, you can run the query below to scan for alerts that reference the ContainerLog table. If needed, adjust them it to your liking.
resources
| where type in~ ('microsoft.insights/scheduledqueryrules') and ['kind'] !in~ ('LogToMetric')
| extend severity = strcat("Sev", properties["severity"])
| extend enabled = tobool(properties["enabled"])
| where enabled in~ ('true')
| where tolower(properties["targetResourceTypes"]) matches regex 'microsoft.operationalinsights/workspaces($|/.*)?' or tolower(properties["targetResourceType"]) matches regex 'microsoft.operationalinsights/workspaces($|/.*)?' or tolower(properties["scopes"]) matches regex 'providers/microsoft.operationalinsights/workspaces($|/.*)?'
| where properties contains "ContainerLog"
| project id,name,type,properties,enabled,severity,subscriptionId
| order by tolower(name) asc
Customizing these alert queries is not part of this blog, as they will likely be quite specific. However, all references to the ContainerLog table will need to be changed to the ContainerLogV2 table.
Enable ContainerLogV2 schema via an existing Data Collection Rule
The first onboarding option we’ll cover is DCR based configuration. Remember that this is not supported for service principle based clusters. If you still want to make use of this experience, migrate your clusters with service principle to managed identity first.
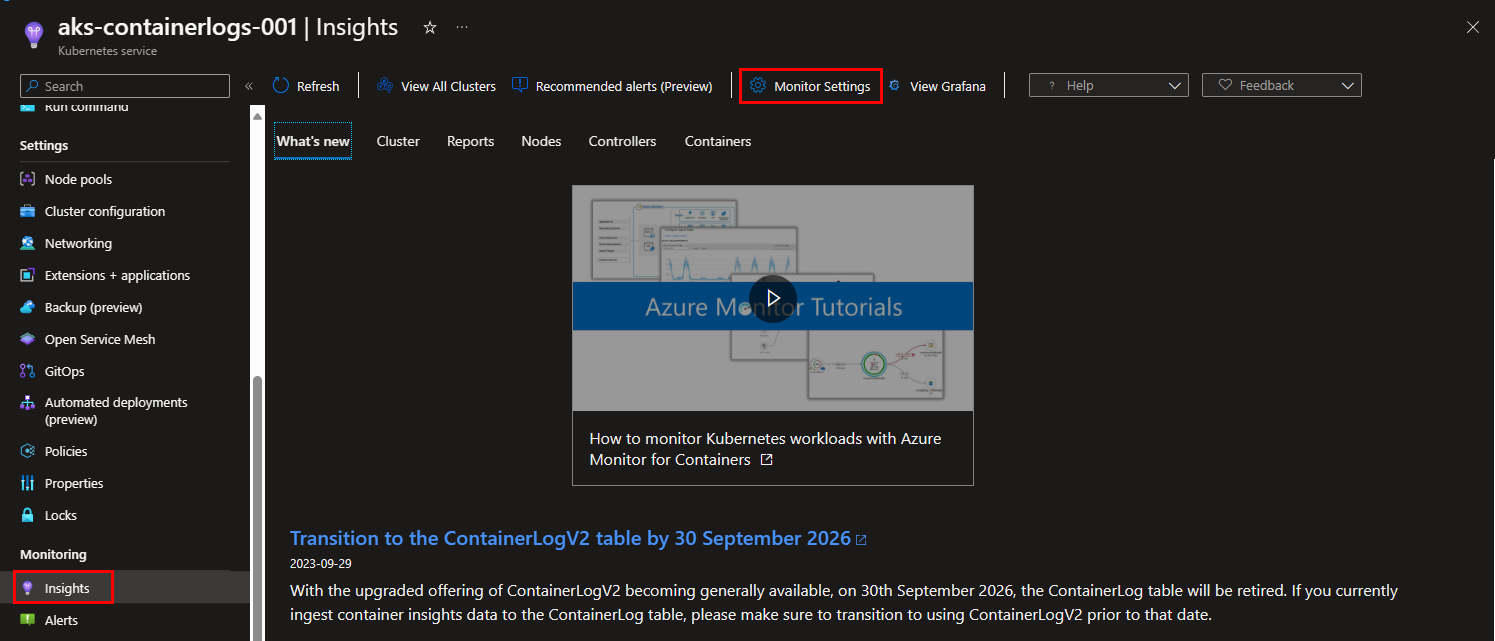
Step 1: Go to your Kubernetes cluster, and select “Insights” from the blade on the left. Select the “Monitor Settings” button at the top of your screen.
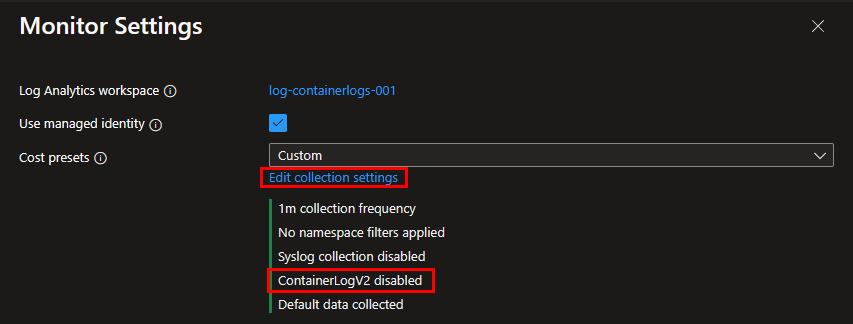
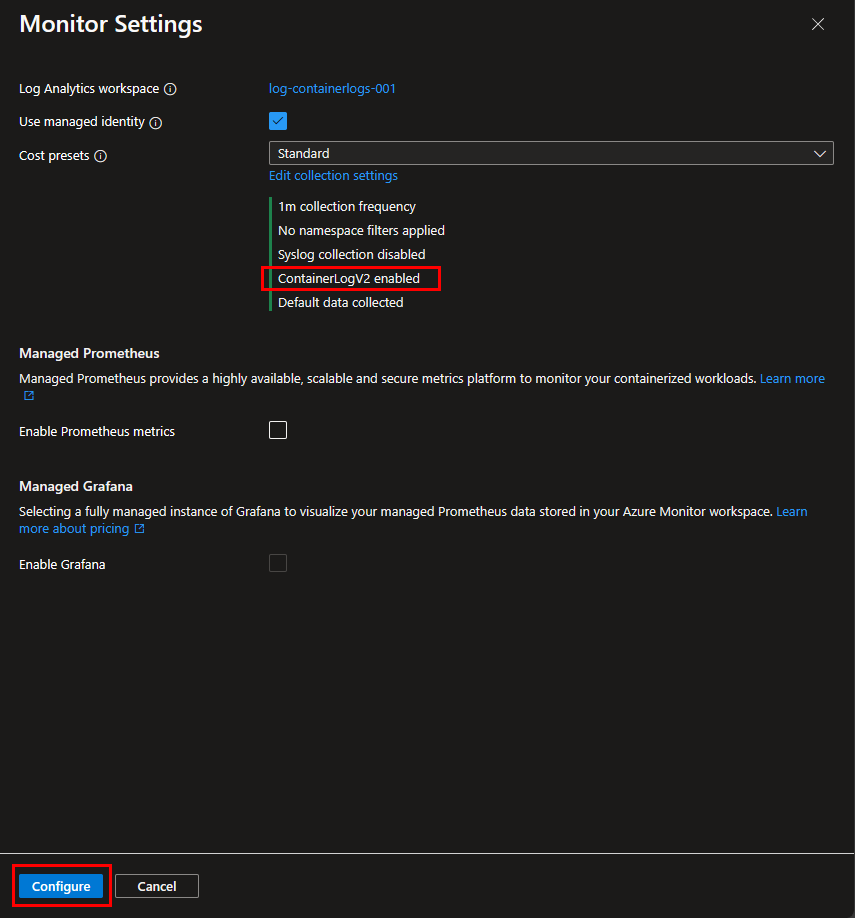
Step 2: In the appearing window on the right, it tells you that ContainerLogV2 is disabled. If not, ContainerLogV2 is probably already enabled. If it’s not enabled, click on “Edit collection settings” to open the advanced settings.
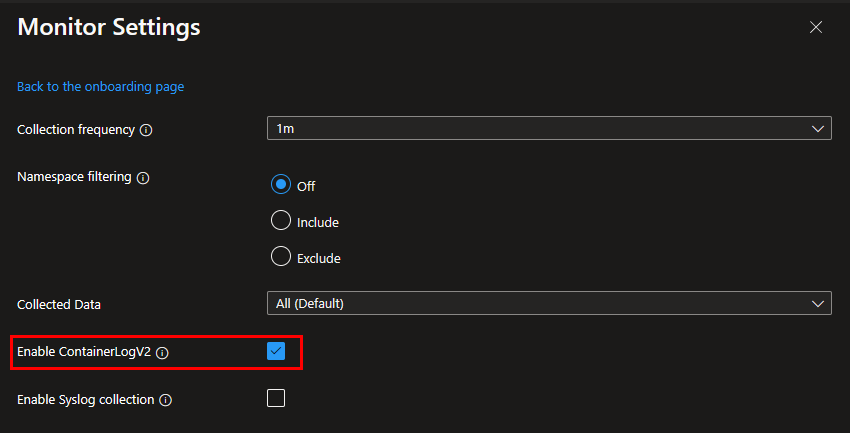
Step 3: Enable ContainerLogV2 by selecting the checkbox next to this option. Don’t forget to hit the “Save” button below, before leaving this window.
Step 4: Back in the initial “Monitor Settings” window, it should now display the message “ContainerLogV2 enabled”. Make sure you hit the “Configure” button on the bottom of this window to complete your configuration change, before leaving this window.
Enable ContainerLogV2 schema via an existing ConfigMap
If you’ve already enabled container insights for your AKS cluster and have configured agent data collection settings using ConfigMap, enabling the ContainerLogV2 schema is fairly easy. In most cases, all you have to do is append the following section in your existing ConfigMap .yaml file:
[log_collection_settings.schema]
          # In the absence of this ConfigMap, the default value for containerlog_schema_version is "v1"
          # Supported values for this setting are "v1","v2"
          containerlog_schema_version = "v2"
Enable ContainerLogV2 schema via a new ConfigMap
When both of the scenario’s above don’t apply to you, it might be a good moment to start configuring agent data collection settings using ConfigMap. Follow the instructions below to quickly do so:
Step 1: Download this new ConfigMap file from Microsoft. Be aware that the default value for containerlog_schema_version is "v1" at the moment of writing.
Step 2: Update containerlog_schema_version to "v2", just as described in the example above in an existing ConfigMap.
Step 3: Apply the new configured ConfigMap, by running the kubectl apply -f <configname> command. So for example:
kubectl apply -f container-azm-ms-agentconfig.yaml
Changes to the configuration may take a few minutes to take effect, depending on your cluster. First, the cluster will go through a rolling restart of all ama-logs pods in the cluster. You are now finished configuring the ConfigMap.
What’s next?
After transitioning from ContainerLogV1 to ContainerLogV2, there are several possible next steps to consider, depending on your specific needs and goals. Here are some common next steps you might take:
- Optimize your queries and take advantage of the enhanced query capabilities provided by ContainerLogV2. Review and optimize your existing queries to leverage the additional metadata and improved querying efficiency.
- If your applications generate multiline logs, consider implementing multiline logging support provided by ContainerLogV2. This will allow you to consolidate multiline entries for easier log analysis.
- Consider revisiting your cost management strategy to take advantage of the low-cost basic logs tier ContainerLogV2 offers.
To learn more about ContainerLogV2 that was covered in this blog article, refer to the links below:
- Overview of Container insights in Azure Monitor - Azure Monitor | Microsoft Learn
- Set a table’s log data plan to Basic Logs or Analytics Logs - Azure Monitor | Microsoft Learn
- Query logs from Container insights - Azure Monitor | Microsoft Learn
- Configure Container insights cost optimization data collection rules - Azure Monitor | Microsoft Learn
- Collect Prometheus metrics with Container insights - Azure Monitor | Microsoft Learn
Thank you for taking the time to go through this post and making it to the end. Stay tuned because we’ll keep continuing providing more content on topics like these in the future.